Set screenas of 2026-09-26
McDonald's Collection 2011
Cards12
Priced12
Median raw ask$7.16
With PSA 10 tape0
Median PSA 10 premium—
Set median, 90d+8.2%
Pick the reading
Which McDonald's Collection 2011 cards have moved least over the last 90 days against the rest of the set? Moves are walked by date on each card's own recorded series; cards that started the window under $5 are left out so penny ticks do not read as moves.
Cohort laggards
9 of 12 qualifyrecorded move over 90 days by date, cards that started the window at $5 or more, weakest first.
| # | Card | Move | From → now | Readings | PSA 10 |
|---|---|---|---|---|---|
| 1 | 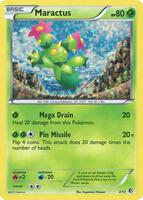 Maractus#2 · None | −0.8%over 27 days | $6.21 → $6.162026-08-30 | 28 | |
| 2 | 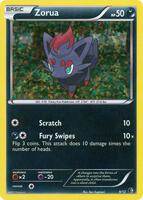 Zorua#9 · None | +2.6%over 27 days | $8.83 → $9.062026-08-30 | 28 | |
| 3 |  Tepig#3 · None | +4.0%over 27 days | $6.82 → $7.092026-08-30 | 28 | |
| 4 |  Munna#7 · None | +7.9%over 27 days | $10.85 → $11.712026-08-30 | 28 | |
| 5 | 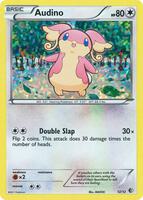 Audino#12 · None | +8.2%over 27 days | $5.83 → $6.312026-08-30 | 28 | |
| 6 |  |
How to read it
Raw is the canonical printing's TCGplayer ask, the same figure the card page shows. PSA 10 and PSA 9 are eBay sold medians verified per listing, printed with their comp counts; a premium is only computed on 5 or more PSA 10 comps.
Gem rates come from the PSA registry snapshot and are only trusted on lines of 100 or more slabs; a zero beside a real population is a provider gap and is withheld, never shown as 0%. Moves and highs come from each product's own recorded series, trimmed at the price-rule change of 2026-09-07, and ignore cards under $5.
Every figure carries its sample. A short series, a thin comp count or a small registry is printed beside the number rather than hidden, and a card that lacks the figure a reading needs is left off that reading instead of scored on a guess.