Ripping arguments are usually settled with one number, expected value, and one number is exactly what a booster box does not have. A box is a distribution. So we ran the distribution: 26 sets, 10,000 simulated boxes per set, each pack rolled against published pull-rate tiers and each pulled card priced at its live market value. The headline is blunt and does not vary by set. In all 26, the expected box comes back worth less than the box costs. In all 26, the median box comes back worth a good deal less than that. Zero sets clear their own price at the mean, and zero clear it at the median. The variation that matters is not whether you lose. It is how you lose.
The board, ranked by what a dollar of box buys back
Rip simulation, eleven of the 26 sets, chosen to span the range rather than as a top eleven, 10,000 boxes per set, sims stamped August 28 to September 2, 2026
| Set | Box price | Expected box | EV per $1 | Median box | P(box beats cost) | P(box loses half) | Bulk share of EV |
|---|---|---|---|---|---|---|---|
| Pitch Black | $170.18 | $116 | 0.68 | $75 | 26% | 55% | 14% |
| Fusion Strike | $969.06 | $647 | 0.67 | $403 | 30% | 57% | 4% |
| Perfect Order | $161.96 | $105 | 0.65 | $82 | 23% | 50% | 14% |
| Chaos Rising | $177.37 | $106 | 0.60 | $64 | 24% | 64% | 14% |
| Mega Evolution | $303.83 | $178 | 0.59 | $119 | 19% | 57% | 10% |
| Phantasmal Flames | $394.85 | $189 | 0.48 | $65 | 14% | 77% | 11% |
| Temporal Forces | $312.25 | $144 | 0.46 | $134 | 2% | 63% | 17% |
| Evolving Skies | $2,445.10 | $820 | 0.34 | $406 | 12% | 74% | 4% |
| Astral Radiance | $411.18 | $91 | 0.22 | $89 | 0% | 100% | 52% |
| Silver Tempest | $504.40 | $85 | 0.17 | $81 | 0% | 100% | 32% |
| Lost Origin | $726.45 | $73 | 0.10 | $70 | 0% | 100% | 44% |
Two decimals is as far as this table is allowed to go, and even that is generous. The simulator draws 10,000 boxes from a random stream, and re-running a set with a different seed moves its EV-per-dollar by as much as 0.027 and its chance of beating cost by up to a point. On the lottery sets the seed-to-seed standard deviation of EV per dollar runs 0.004 to 0.007; on the flat ones it is under 0.001. So Pitch Black at 0.68 and Fusion Strike at 0.67 are not ranked, they are tied, and so are Chaos Rising and Mega Evolution. Only differences of roughly three points or more in this column mean anything, and we have stopped printing the third decimal that made the ordering look decidable.
Read the last three rows as a group, and then discount them, because a recheck of the simulator says they measure our own tier classifier rather than the product. Astral Radiance, Silver Tempest and Lost Origin each return zero boxes out of 10,000 that beat their own cost, each loses more than half the box price in every simulated box, and none of them shows any tail: Lost Origin's 95th percentile box is $115 against a $70 median, a spread of 1.6x, on a box that costs $726.45. That flatness is manufactured. The classifier counts a card as a hit only when it is numbered above the set's printed total, and in these Sword and Shield sets the card the box is bought for is numbered inside it: the alt-art Giratina V is Lost Origin 186 of 196, the alt-art Lugia V is Silver Tempest 186 of 195, the alt-art Machamp V is Astral Radiance 171 of 189. All three are valued as bulk, and the dearest card the simulator can pull from Lost Origin is a $28.71 secret-numbered Giratina VSTAR. What these rows describe is a box with its chase cards removed, so no reading of the product should be taken from them.
Those rows also carry a warning about what is actually in them. On Astral Radiance 52% of the entire expected value is the bulk term, a flat per-box credit for the commons and reverses, and on Lost Origin it is 44%. That is not a chase product being valued, it is a pile of bulk being valued, and the bulk term is itself a haircut estimate rather than a measurement. When we say Lost Origin returns ten cents on the dollar, roughly four and a half of those ten cents are an assumption about what bulk is worth.
Two distributions wearing the same word
Sort the 26 sets not by expected value but by how far the 95th percentile box sits above the median box, and the board splits cleanly into two products that the hobby calls by one name. On one side sit the lotteries. Phantasmal Flames is the extreme: a $394.85 box whose typical outcome is $65 and whose 95th percentile is $747, an 11.4x spread, with a 76.6% chance of losing half your money. Its mean, $189, is 2.9 times its median, which is the arithmetic signature of a product where a small number of enormous outcomes carry the whole average. Quoting the mean of a distribution like that as though it described a box is the single most common error in rip content.
On the other side sit the annuities. Temporal Forces is the cleanest example: a $312.25 box, expected $144, median $134, 95th percentile only 2.0x the median, 2% chance of beating cost. Nothing dramatic ever happens. You put in $312.25 and you take out something very close to $134 nearly every time. It is a reliable, boring, roughly 57% haircut. A buyer who wants a chance at a windfall and buys a Temporal Forces box has bought the wrong instrument even though its expected value per dollar, 0.46, is better than Evolving Skies at 0.34. Expected value ranks these products in one order and the reason people buy them ranks them in a different one.
Where the money in a box actually is
The simulator reports its tiers, and the Evolving Skies decomposition explains the entire modern rip trade in three lines. Its illustration-rare tier holds 20 cards, appears about 2.99 times per box in the simulation, above what the era's own published study implies for that pool and drawn uniformly, so the simulator treats the dearest card in the pool as no less likely than the cheapest, which is the defect the methodology now describes, and averages $262.40 per hit; the dearest card in that pool is Umbreon VMAX at $2,378.74. Its secret tier holds 14 cards, appears about 1.81 times per box, and averages $6.49 per hit. The double-rare tier is empty of priced product. So a box's outcome is close to a bet on three draws from one 20-card pool worth $5,248 in total, of which the single dearest card is $2,378.74 and the other nineteen together are $2,869. The top card is not worth more than the rest of the pool, though an earlier draft of this piece said it was and the tier table it cited says otherwise. It is worth more than any six of its poolmates, which is enough to give the distribution a $50 fifth percentile and a $2,889 ninety-fifth on a $2,445.10 box, and to put 74% of boxes below half their cost.
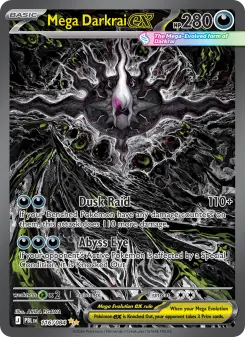
The same structure, at a tenth of the price, is what makes the current Mega-era sets the best ratios on the board. Pitch Black at about 0.68 is not good because its chase card is special. It is good because its box price has not yet been marked up to the value of the cards inside it. Fusion Strike sits beside it at 0.67 and does not belong there: its alt-art VMAXes ARE numbered above the printed set, so the classifier files them as illustration rares and the simulator deals about three cards a box uniformly at random from a nine-card pool in which a $1,017 Gengar VMAX is as likely to fall out as a $5 gold energy. The era's own published study puts an alt-art VMAX nearer one pack in three hundred. The closed-form recheck in Booster Box Expected Value Has Error Bars puts the same box at 0.167 of its ask, and that is the figure to use. Mega Darkrai ex at $204.17 behind a $170.18 box is a different trade from Umbreon VMAX at $2,378.74 behind a $2,445.10 box, and the difference is not the card, it is the price of the ticket. Our Lottery Ticket Index measures that same asymmetry from the chase side; this piece measures it from the distribution side, and the two agree because they are two views of one arithmetic.
The rule the simulation supports
If a set's 95th percentile box is under about 2.5x its median, there is no jackpot in the product and no reason to open it for value: buy the single you want, which our rip or hold study prices from the sealed side. If the ratio is above about 4x, the product is a genuine lottery, and the correct frame is entertainment spend at a now-visible price, with the median outcome, not the mean, as the number to expect. And in every one of the 26 cases, the box price is the ceiling on what comes out of it in expectation. The sim has never once found a set where the market underprices its own boxes, which is what you would expect from a market where the people selling boxes can also open them. Every price feeding that conclusion is a quoted price, and The Frozen Tape shows how rarely such a quote moves.
Source: moonstone's rip simulator output, read from production on September 2, 2026. 26 distinct sets, 10,000 simulated boxes each. The odds are the weakest input and an earlier version of this methodology described them wrongly. The simulator does NOT roll each set's own published study. It rolls one hardcoded per-pack triple, a double rare 1 in 4, an illustration rare 1 in 12 and a secret 1 in 20, taken from community-documented Scarlet and Violet and Mega-era averages, and applies that triple to every set in the panel whatever its era. It also assigns cards to those tiers by a Scarlet and Violet rule: a card is a double rare only if its name ends in the word ex, and it is a hit at all only if it is numbered above the set's printed total. Within a tier the draw is uniform, so the pool's dearest card is as likely to fall out as its cheapest, which flatters any tier holding one very expensive card. Prices are each pulled card's live market value. Two known limitations of that construction both push expected value DOWN, which means they flatter this piece's thesis rather than the ripper's, and an earlier draft described them backwards: cards with no price count as zero, and the bulk term applies a 50% haircut to the median non-hit card. Anyone who believes bulk is worth more than we credit, or that unpriced cards are worth something, should read every EV figure here as a floor. Seed sensitivity is real and is now stated rather than implied: the published run for each set is a single 10,000-box draw, and across twenty independent seeds a set's EV per dollar moves by up to 0.027 with a standard deviation of 0.0003 to 0.007 depending on how heavy its tail is. Rows within about three points of each other in the EV-per-dollar column are therefore not ranked. Probabilities are frequency counts over 10,000 draws, not analytic solutions, and carry Monte Carlo error of roughly half a percentage point. Individual set sims carry their own build stamps spanning August 28 to September 2, 2026, so a box price quoted here can differ slightly from today's sealed catalog quote (Evolving Skies: $2,445.10 in the sim, $2,474.88 in the catalog; Pitch Black: $170.18 in the sim, $175.46 in the catalog). The Umbreon VMAX figure of $2,378.74 is the canonical printing price on both the sim's tier table and today's catalog; the $2,310.74 quoted in an earlier draft was a different FIELD of the same cache row, the flagship-printing price, not a different date. One set is simulated but excluded from the table above: Legendary Treasures, whose catalog box price of $18,750.00 sits against a simulated pool holding exactly two priced illustration rares and no secrets, so its 0.07 EV per dollar is a statement about our pool coverage rather than about the product, and 17% of what little EV it has is the bulk term. It is a data-quality artifact and we would rather delete it than rank it. That disqualification, applied consistently, reaches further than one row, and on a recheck it reaches every Sword and Shield set in the panel, because all of them are classified by a Scarlet and Violet rule and rolled at Scarlet and Violet odds. It fails in both directions. Where the era's alt arts are numbered inside the printed set, as in Astral Radiance, Silver Tempest, Lost Origin, Chilling Reign, Rebel Clash, Darkness Ablaze, Vivid Voltage, Brilliant Stars, Battle Styles and Sword & Shield, those cards are valued as bulk and the box reads flatter and poorer than it is. Where they are numbered above it, as in Fusion Strike and Evolving Skies, they are dealt at illustration-rare odds many times their measured rate and the box reads richer. Treat every Sword and Shield row here as a statement about our classifier rather than about the product. The Scarlet and Violet and Mega-era rows, where the classifier and the odds were built for the era in front of them, are the ones this piece defends, and for any single set the closed-form recheck across 27 sets published on September 22, 2026 as Booster Box Expected Value Has Error Bars is the figure to prefer. The headline, that no set clears its own box price, is unchanged by all of this and is reproduced independently by that study. Nothing here is financial advice.