Ask a seller for 20% off a lightly played copy and whether that is a good deal depends almost entirely on what the card costs. Under $5 it beats the going quote on 65.5% of cards. At $200 and up it beats it on 26.2%. Behind that sit the four rungs of the ladder, each measured inside a single card with both quotes carrying the same observation date, across 10,658 lightly played pairs and 30,926 pairs in all, on English cards read on September 28, 2026: a lightly played copy is quoted at a median 82.9% of the same card's Near Mint price, moderately played 60.6%, heavily played 42.9%, damaged 36.0%. Paying 80% of Near Mint undercuts the going lightly played quote on 65.5% of cards under $5, on 49.7% of cards between $5 and $20, on 40.8% between $20 and $50, and on 26.2% of cards at $200 and up. The discount curve steepens with the price tag on all four rungs, so the same flat percentage is generous at the bottom of the catalogue and thin at the top. The crossover sits in the $5 to $20 band, close enough to a coin flip that it is not worth arguing over.
What a condition quote is, and what it is not
Every figure here comes from `condition_quotes`, which holds one quote per card per condition: the provider's per-condition market figure for that card's primary printing, carrying the date the provider last observed it. That makes it an ASK, a number derived from live listings, and not a recorded sale. Nothing in this guide is a transaction. If you want the gap between what a seller asks and what a card actually trades for, that is Ask Versus Sold, and the reasons an ask can be fiction are in The Ask Is Lying to You.
The word Near Mint is doing real work in that sentence, and it is the reason this study exists at all. The daily price feed carries one figure per product with no condition column, and the provider produces that figure by falling down the card's condition ladder whenever the top of it has no recent data. On September 25, 2026 that behaviour published a 63.7% fall on a card whose Near Mint price had not moved, and a subscriber wrote in to say so. The quotes below are labelled by condition at the source, so the Near Mint leg of every ratio is genuinely Near Mint. Which figure you are looking at on any given page is the subject of Which Market Price, and how to tell a quote has gone stale is How to Tell a Pokémon Card Price Is Stale.
One more property matters before the numbers. Each product's ladder describes one printing and names it, and every one of the 21,197 products carrying a printing name carries exactly one across all five rungs. A ladder therefore cannot compare a reverse holo Near Mint against a normal damaged, which is the failure mode that would quietly manufacture a discount out of nothing, and the distance between those two finishes is wide enough to matter: it is measured in Are Reverse Holo Pokémon Cards Worth More?. One caveat belongs beside that reassurance. On 5,969 of the 10,909 lightly played pairs, more than half, the provider reports the product as having two or three printings. Every ratio here stays inside the single printing the ladder names, so no discount is manufactured, but the printing a card page prices may not be the same one.
What each step down the ladder costs
Median quote as a share of the same card's Near Mint price, by condition
The full distribution of each rung against Near Mint, not just its middle
| Condition | Pairs | p25 | Median | p75 | At or below half of NM | Quoted above NM |
|---|---|---|---|---|---|---|
| Lightly Played | 10,658 | 68.7% | 82.9% | 96.4% | 6.6% | 19.4% |
| Moderately Played | 9,180 | 45.5% | 60.6% | 76.8% | 33.1% | 7.4% |
| Heavily Played | 5,449 | 29.1% | 42.9% | 60.2% | 61.7% | 3.8% |
| Damaged | 5,639 | 23.3% | 36.0% | 53.4% | 70.9% | 3.4% |
The quartiles are the part to memorise, because the median on its own will lose you money. A quarter of lightly played quotes sit above 96.4% of Near Mint and a quarter sit below 68.7%, so there is no single lightly played number to hold a seller to. The spread is wider than the discount. And the rungs are not evenly spaced: measured as adjacent steps inside the same card, Near Mint to lightly played costs 17.1% of the rung above it, lightly played to moderately played costs 25.6%, moderately played to heavily played 24.7%, and heavily played to damaged only 19.6%. Falling off the top of the ladder is cheaper than falling through its middle.
Is a lightly played copy at 20% off a good deal?
Read the curve below at 80 on the horizontal axis. That is the point where you are paying 20% under Near Mint, and the height of each line there is the share of cards whose own quote for that condition is already at or below what you would be paying. For lightly played it is 44.5%, which means 55.5% of lightly played cards are quoted above 80% of Near Mint and a flat 20% discount undercuts them. Pooled over everything, a 20%-off lightly played copy is therefore a slight edge to the buyer. Pooled is the wrong way to read it.
Where each condition's quotes actually sit, as a share of Near Mint
How often 20% off Near Mint undercuts the going lightly played quote, by what the card costs
| Near Mint price | LP pairs | Median LP share of NM | Share where 20% off is cheaper than the quote | Verdict on a flat 20% off |
|---|---|---|---|---|
| under $5 | 6,037 | 88.2% | 65.5% | a real discount |
| $5 to $20 | 2,055 | 79.9% | 49.7% | a coin flip |
| $20 to $50 | 1,269 | 75.1% | 40.8% | usually above the going rate |
| $50 to $200 | 1,007 | 72.3% | 34.5% | usually above the going rate |
| $200 and up | 290 | 70.2% | 26.2% | you are paying up three times in four |
On a $2 common, 20% off a lightly played copy is better than two thirds of the market, because cheap cards are rarely discounted far and their quotes cluster just under Near Mint. On a $400 card, 20% off is worse than roughly three quarters of the market, because the going rate for a lightly played copy of an expensive card is nearer 30% off. A percentage rule of thumb that works at the bottom of a binder quietly overpays at the top of it.
Wear costs more, in percentage terms, the dearer the card
Median share of Near Mint on every rung, by what the Near Mint copy costs
| Near Mint price | Products with a same-day pair | Lightly Played | Moderately Played | Heavily Played | Damaged |
|---|---|---|---|---|---|
| under $5 | 6,054 | 88.2% (6,037) | 65.0% (5,089) | 54.3% (2,380) | 49.0% (2,121) |
| $5 to $20 | 2,068 | 79.9% (2,055) | 59.8% (1,803) | 38.6% (1,257) | 34.1% (1,491) |
| $20 to $50 | 1,291 | 75.1% (1,269) | 53.7% (1,121) | 35.1% (848) | 29.0% (968) |
| $50 to $200 | 1,050 | 72.3% (1,007) | 51.1% (901) | 34.7% (744) | 27.6% (813) |
| $200 and up | 332 | 70.2% (290) | 46.0% (268) | 30.5% (221) | 25.0% (245) |
Every column falls monotonically as the card gets dearer, which is not something we assumed and is the finding we would most want checked. The gap is widest on the bottom two rungs: a damaged cheap card keeps roughly half its Near Mint price and a damaged $200 card keeps a quarter. A plausible reading is that buyers of expensive cards are condition-sensitive because many of them are grading candidates, and one soft corner turns a submission into a display copy. We have not tested that here, and this guide does not claim it. What the numbers support is the pattern, not the cause. If grading is the mechanism, How Much a PSA 10 Adds, Across 8,676 Cards is where the size of that prize is measured.
What a real ladder looks like, one card per price band
Five cards whose lightly played share sits near their band's median, with all five rungs observed on one date
| Card | Observed | Near Mint | Lightly Played | Moderately Played | Heavily Played | Damaged |
|---|---|---|---|---|---|---|
| Wigglytuff GX, Hidden Fates | 2026-09-26 | $3.71 | $3.27 (88.1%) | $3.03 (81.7%) | $2.13 (57.4%) | $1.48 (39.9%) |
| Dialga GX, Ultra Prism | 2026-09-27 | $13.15 | $10.49 (79.8%) | $6.84 (52.0%) | $5.77 (43.9%) | $4.79 (36.4%) |
| Scyther, Platinum | 2026-09-24 | $31.93 | $23.97 (75.1%) | $17.13 (53.6%) | $12.22 (38.3%) | $9.28 (29.1%) |
| Entei & Raikou LEGEND, Unleashed | 2026-09-24 | $150.15 | $108.50 (72.3%) | $82.73 (55.1%) | $66.83 (44.5%) | $50.87 (33.9%) |
| Team Aqua's Kyogre EX, Double Crisis | 2026-09-24 | $571.44 | $403.20 (70.6%) | $241.22 (42.2%) | $192.94 (33.8%) | $155.26 (27.2%) |
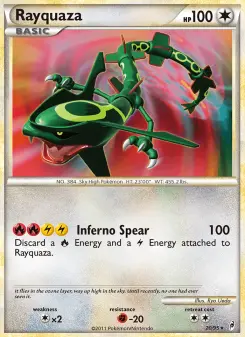
Those five are picked to sit near the middle of their bands, so they show the shape rather than the extremes. The extremes are worth seeing too. Rayquaza from Call of Legends carries the harshest complete ladder we hold above $50: Near Mint $1,013.27, lightly played $118.65, moderately played $99.52, heavily played $39.74, damaged $21.93, all observed on September 24. That is 11.7% for a card with edge wear. Our August reading of the same card put its lightly played share at 16.2% when Near Mint was $599, so the ratio has tightened as the Near Mint quote has climbed, which is consistent with the value gradient without being a test of it. Ranked on that same rule, a complete ladder with every rung on one date and a Near Mint quote above $50, the three behind it are Torchic from McDonald's Collection 2015 at 18.0%, Rotom from Great Encounters at 20.0% and Deoxys ex from Emerald at 20.6%. Team Aqua's Kyogre from Team Magma vs Team Aqua reads a harsher 15.7% on its Near Mint and lightly played pair, but its damaged quote was last observed five weeks before its other four rungs, so it is not a same-date ladder and is not ranked here. McDonald's Collection 2015, Emerald and Team Magma vs Team Aqua have no set page on this site, so they are named rather than linked.
Heavily played and damaged are quoted closer together than you would guess
The last step on the ladder is shallower than either of the two in its middle. Inside the same card, a damaged copy is quoted at a median 80.4% of the heavily played copy, against 74.4% for lightly played to moderately played and 75.3% for moderately played to heavily played. If you are buying a beater to fill a slot, the distance between heavily played and damaged is about a fifth of the price, so paying heavily played money for a card the seller has graded damaged is a smaller mistake than the labels suggest, and refusing a damaged copy on principle at a 20% saving is often the worse trade.
One caution on those two rungs. There are 5,449 heavily played pairs against 10,658 lightly played ones, so roughly half the cards with a lightly played pair carry no heavily played quote on the same observation date. About a third of that gap is a genuinely absent quote and the rest is one we last saw a median 46 days earlier, which our same-date rule excludes. Either way it is an unknown and never a zero to be averaged in: a missing heavily played quote does not mean a heavily played copy is worth nothing. It also means the bottom two rungs are measured on a smaller and differently composed sample than the top two, which is the honest reason we lead with lightly played.
Why this does not overturn our August reading
The Condition Tax published LP 76.5%, MP 54.2% and damaged 31.9% on 4,915 cards on August 26, 2026, and the pooled figures above are 6.4 points higher on lightly played and 6.4 on moderately played. That is composition, not a correction, and the checks say so. 56.6% of the 10,658 lightly played pairs here sit under $5, where the rung runs 88.2%, so a larger and cheaper sample pulls the pooled median up mechanically. At the earlier article's own cut the two agree to within a point: it read 71.2% on cards over $50 and this sample reads 71.8%. Weighting the five price bands equally instead of pooling them gives 77.1%, which is 0.6 points from its 76.5%. Two independent ways of removing the composition difference land on the earlier number, so treat that article as right about the cards it measured and this one as a wider and banded version of it. A second sibling reading agrees on the bottom of the ladder, and it is the one this guide most wants checked. The Basement of the Registry measured 901 product printings and published lightly played 79.2%, moderately played 58.3%, heavily played 41.1% and damaged 34.9%. Its heavily played figure sits 1.8 points from this sample's 42.9% on six times the pairs, which is the closest independent check that rung has.
What this guide adds to those two readings is the banding, which holds on all four rungs rather than on lightly played alone, and the count of quotes that break the ladder: a fifth of lightly played quotes sit at or above Near Mint, which an earlier article noted at the 100% mark without counting. Where the three disagree, prefer the banded rows below to any single pooled number from any of them.
The four ways this is wrong
First objection, and the one that matters most: your coverage is not uniform, so the pooled figure is an artefact. Conceded, and this is why the banded table is the result and the pooled median is a headline. The sweep that fills these quotes walks cards above $10 first, so of the 21,413 priced English products on September 28 the share carrying a Near Mint quote runs 40.4% under $5, 69.0% between $5 and $20, then 99.7%, 98.2% and 96.0% in the three bands above $20. Every figure over $20 rests on a near-complete census of that band. Every pooled figure is a weighted average of an unevenly sampled catalogue, and anyone quoting one number from this guide should quote a banded one.
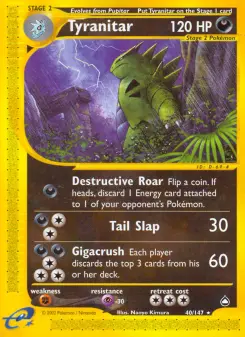
Second objection: a fifth of your lightly played quotes are above Near Mint, so the instrument is broken. 19.4% of the 10,658 same-day lightly played pairs quote lightly played above Near Mint and a further 2.4% quote it to the cent. We print that rather than trimming it, because it is the warning a buyer can act on: a rung quoted at or above the rung above it is a rung with no live listing near it, and a price discovered by one listing is not a discount curve. Tyranitar from Aquapolis reads Near Mint $56.09 and lightly played $111.63 on the same date, on the Normal printing. Dark Charizard from Team Rocket reads Near Mint $121.94 and lightly played $576.97 on its 1st Edition Holofoil printing, which is the printing whose premium How Much More Is a 1st Edition Pokemon Card Worth? measures. In both cases the Near Mint rung is the leg that moved, and our own Near Mint series says so: Tyranitar held $0.32 every day to September 18 and $56.09 from September 19, and Dark Charizard fell from $265.83 to $121.94 on September 17, landing exactly on that day's cheapest-printing figure while the card's own page headlines $373.56. So the mechanism is a Near Mint rung tracking one cheap listing rather than the market, and a lightly played quote at or above Near Mint is a missing Near Mint price. Treat it as an absent number, not a bargain and not a premium.
Third objection: if your ladders do not fall in order, the whole ladder idea is wrong. Partly fair, and the shape of the failure is informative. Of the 3,929 products carrying all five rungs on one observation date, 2,483 fall in strict order from Near Mint down to damaged, which is 63.2%. Allowing a one-cent tolerance moves it only to 64.7%, so this is not a rounding effect. It is a price effect: order holds on 34.3% of ladders under $5, 70.7% between $5 and $20, 83.7% between $20 and $50, 84.9% between $50 and $200, and 89.3% at $200 and up. Cheap cards have thin listings on several rungs at once, so their ladders wobble. Cards at $200 and up hold their order about nine times in ten. Read the banded table with that in mind: the rows you would actually spend money on are the well-behaved ones.
Fourth objection: these are asks, and an ask is not what a played card sells for. Correct, and there is no way around it with the data we hold, because no source we hold carries a per-condition sold record for raw cards. What we can say is how fresh the asks are: 10,890 of the 11,308 English Near Mint quotes were observed within 7 days of the read, 161 at 8 to 30 days, 155 at 31 to 90, 77 at 91 to 180 and 25 older than that, the oldest 434 days. Both legs of every ratio in this guide carry the same observation date, so a stale quote can make a ratio old but it cannot make it mismatched. How many sales it takes before a number deserves to be called a price is the subject of How Many Sales Is a Price.
What would overturn this
The value gradient is the claim with the most riding on it, and the cheapest test is to run the banded table again once coverage under $5 catches up with coverage above $20. If the sub-$5 lightly played share falls from 88.2% toward 80% as the thin half of that band is filled in, the gradient is partly a coverage effect and the top-to-bottom spread should be quoted narrower than 18 points. If it holds near 88% on a complete census of that band, the gradient is a property of the market. The second test needs a source we do not have: a per-condition record of completed sales rather than listings. Where a sold ladder exists, the discounts should come out steeper than these asks, because a seller asking Near Mint money for a played copy is exactly the listing that does not sell and therefore stays up to be counted. If sold discounts came out shallower than the asks here, the direction of that bias would be wrong and this guide would need rebuilding rather than adjusting.
Source: `condition_quotes`, read on 2026-09-28 UTC, holding 81,928 rows over 20,880 products across the five conditions NM, LP, MP, HP and DMG. Its primary key is (tcg_id, condition), so it is a current snapshot with one row per product per condition, upserted in place. It is not a time series: the 259 distinct `as_of` values spanning 2025-03-24 to 2026-09-28 are the dates the provider last observed each product, which is staleness rather than history. Each row is the provider's per-condition market figure for the product's primary printing, an ASK derived from live listings, never a recorded sale; every product carrying a printing name carries exactly one, so no ratio crosses printings. Population: English `cards` rows with a non-empty tcg_id, collapsed to one row per tcg_id by taking the lexically first card id, giving 11,354 English products present in the table, of which 11,308 carry a Near Mint quote above zero. 4,585 Japanese products and 4,941 products matching no `cards` row are excluded, so every figure is English. Dedupe is on the TCGplayer product id and not the catalogue id, because 243 TCGplayer ids are claimed by two English catalogue rows each, 486 rows in all, 89 of those ids present in this table; counting both rows would inflate a sample size by about 1% and double-count both tails. Ratios are computed WITHIN a product, each rung against that product's own Near Mint quote, and only where the two quotes carry the SAME `as_of` date. That pairwise rule is stricter than the alternative of requiring all five rungs on one date, which would leave 3,929 products, and looser than ignoring dates, which changes the lightly played median by 0.3 points (82.9% same-date against 82.6% any-date) and the heavily played median by 3.1. Sample sizes: 30,926 same-date pairs in all, 10,658 lightly played, 9,180 moderately played, 5,449 heavily played, 5,639 damaged. Medians take the upper-middle value on even samples; p25 and p75 are order statistics on the same convention. Adjacent-step figures pair each rung against the rung immediately above it under the same same-date rule: 10,658 NM-to-LP, 9,279 LP-to-MP, 5,310 MP-to-HP, 4,255 HP-to-DMG. Price bands are cut on the product's own Near Mint quote at $5, $20, $50 and $200, half-open upward. Coverage bands alone are cut on that day's `price_history` ask, since a product carrying no Near Mint quote has nothing else to band on. Coverage figures divide the products carrying a Near Mint quote by the English products carrying a `price_history` ask on day 20724, which is 2026-09-28: 21,413 priced products in all. Monotonicity is tested only on the 3,929 products with all five rungs on one date, requiring NM >= LP >= MP >= HP >= DMG; the one-cent tolerance variant is reported alongside it. Nothing is excluded for looking wrong: the 2,069 pairs quoting lightly played above Near Mint and the 258 quoting it to the cent are counted in every median and disclosed in the sceptic's section, because a median computed after deleting the inconvenient tail is not a median. No graded figure appears anywhere in this guide, so `graded_snapshots` and its two keyspaces are not involved and no sold median is mixed with an ask. Link check, run once across the whole wave on 2026-09-28: every card id printed anywhere in these five studies resolves to a catalogue row whose name matches the label the sentence gives it, all 129 of them; every set link returned 200 from production; and every linked article slug resolves inside this corpus. McDonald's Collection 2015, Team Magma vs Team Aqua, Emerald and Team Rocket Returns have no set page on this site and are named in prose without a link. REPRODUCIBILITY, stated plainly: this table is upserted continuously by the Near Mint sweep, so it is not pinnable to a day the way a price series is. The measured drift, across four reads of this wave, is this. At 81,137 rows the lightly played median read 82.75%; at the 81,928 rows above it read 82.87%; an independent recompute one sweep day later, at 82,684 rows and 10,853 pairs, read 82.76%; and a further read at 83,393 rows and 10,910 pairs read 82.80%. So the sample grows by roughly 700 rows a day, the pooled lightly played median moves about a tenth of a point a day, and the sub-$5 band, which the sweep is still filling, moves about two tenths. Every ratio median here is therefore quoted to one decimal place and none of them should be carried past the first: read the headline as about 83%, and quote the banded rows rather than the pooled one. Nothing here is investment advice.