Three weeks ago we published a forensic piece about one set, 30th Celebration, where six cards sat at exactly $49.99 for up to seventeen straight days and the whole set had produced zero recorded sales. The obvious next question is how much of that we do to the entire catalog. We now have the answer, because between August 30 and September 19 we recorded 994,132 daily price readings across 52,542 cards. Restrict to the 35,507 cards that produced a reading on all 21 days, and 7,795 of them, 22.0%, returned the identical number every time. Not a small drift. Not a rounding wobble. One price, twenty-one days.
Most of the catalog barely moves, and a fifth does not move at all
The shape here matters more than the headline. 7,795 cards produced exactly one distinct price across the window. Another 6,836 produced exactly two, and 5,396 produced three. Take the first two groups together and 41.2% of fully-covered cards changed price at most once in three weeks; add the third and 56.4% changed at most twice. At the other end, no card in the catalog produced more than 17 distinct prices out of 21 days, and 271 cards are tied at that ceiling with another 429 at sixteen. There is no card in our data that reprices daily.
Distinct prices produced over 21 days
The expensive end is the frozen end
Here is the result we did not expect. If a frozen price is a symptom of nobody trading a card, you would expect it to be a bulk problem: worthless commons nobody bothers to reprice. It is the opposite. Sort by average price over the window and the frozen share climbs almost monotonically from $5 upward, reaching 51.5% above $500. The cards our readers care most about, and pay the most for, are the cards whose published price is most likely to be a number that has not been tested in three weeks.
Frozen share by price level, 21-day window
| Average price | Cards | Never moved | Frozen share | Avg distinct prices |
|---|---|---|---|---|
| Under $1 | 14,270 | 2,281 | 16.0% | 3.67 |
| $1 to $5 | 6,081 | 745 | 12.3% | 6.03 |
| $5 to $20 | 8,144 | 2,284 | 28.0% | 4.92 |
| $20 to $100 | 5,234 | 1,727 | 33.0% | 3.97 |
| $100 to $500 | 1,572 | 652 | 41.5% | 2.96 |
| $500 and up | 206 | 106 | 51.5% | 2.32 |
The $1 to $5 band is the liveliest thing in the catalog, at 12.3% frozen and 6.03 distinct prices per card. That band is where bulk-adjacent modern singles live: thousands of listings, constant undercutting, an algorithmically repriced floor. The under-$1 band is slightly more frozen than that, at 16.0%, because a card that costs 15 cents has nowhere left to go. But from $5 upward the trend is one direction only. By the time you reach four figures, a price is a standing ask that nobody has met.
Where the freeze lives, and where it does not
Break the frozen share out by set and the split is clean enough to be a rule. Promotional sets, especially Japanese ones, are almost entirely frozen. Sets with a real collector market and a deep sales history are not frozen at all. Fourteen sets with at least 60 fully-covered cards produced zero frozen cards between them: nine WotC-era sets, and five modern ones that are not old at all, the two Shiny Vaults, Crown Zenith's Galarian Gallery, Black Bolt and the Mega Evolution promo run.
The six most frozen sets, and six of the fourteen at zero
| Set | Fully-covered cards | Never moved | Frozen share |
|---|---|---|---|
| bw-p promotional cards | 75 | 62 | 82.7% |
| Mysterious Mountains | 63 | 51 | 81.0% |
| pcg-p promotional cards | 89 | 71 | 79.8% |
| xy-p: XY promos | 121 | 95 | 78.5% |
| The Town on No Map | 71 | 55 | 77.5% |
| sm-p: Sun & Moon promos | 193 | 142 | 73.6% |
| Base Set | 101 | 0 | 0.0% |
| Base Set (Shadowless) | 102 | 0 | 0.0% |
| Base Set 2 | 130 | 0 | 0.0% |
| Fossil | 62 | 0 | 0.0% |
| Gym Heroes | 132 | 0 | 0.0% |
| Jungle | 64 | 0 | 0.0% |
The WotC originals are the tell, and not for the reason you would guess. Base Set is not a set of expensive cards: 68 of its 101 fully-covered cards average under $5, and its median card is $2.56. Jungle and Fossil sit higher, at medians of $9.62 and $7.32, so they are not quite the bargain bin Base Set is. What all three share is that not one of their fully-covered cards held a single price for three weeks. Match them against Japanese promos band for band and the contrast is total: in the $5 to $20, $20 to $100 and $100-plus bands, these three sets are 0.0% frozen and the Japanese promo sets are frozen roughly three times in four. Age does not freeze a card and neither does price. Absence of buyers does, and a 1999 common that thousands of people still trade has more buyers than a promo that was never really for sale. Japanese promotional runs are thinly listed, rarely sold and almost never repriced, so their published number is closer to a historical artifact than a quote.
The expensive cards that did not move at all
386 fully-covered cards above $200 returned the identical price on all 21 days, and 32 of those are four-figure cards. Six of the thirty-two are below, picked to spread across the range rather than to rank it; the two dearest of the thirty-two lead the list, and the rest of it runs down to a pair of Skyridge rares at a flat $1,000. The number beside each is not a range, because there is no range. It is the single value we recorded every day for three weeks.
Six of the 32 four-figure prices that never moved

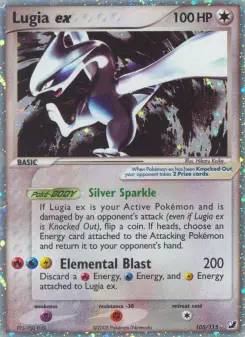
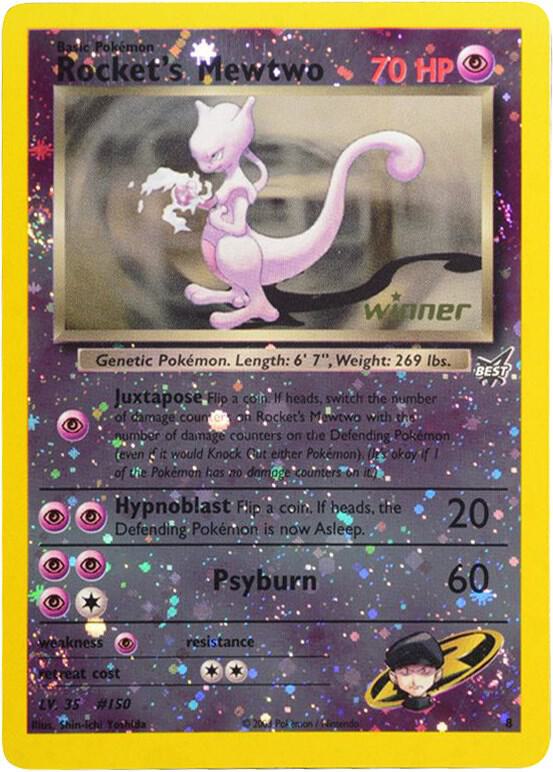

Round numbers recur in that list for a reason. $3,500.00, $2,500.00, $2,400.00: these are seller-chosen asks, not transaction prints. A market that has cleared a trade rarely lands on a figure ending in three zeros. The ask is lying to you made this argument structurally; this is the same argument with a 21-day stopwatch on it.
What a card that actually trades looks like
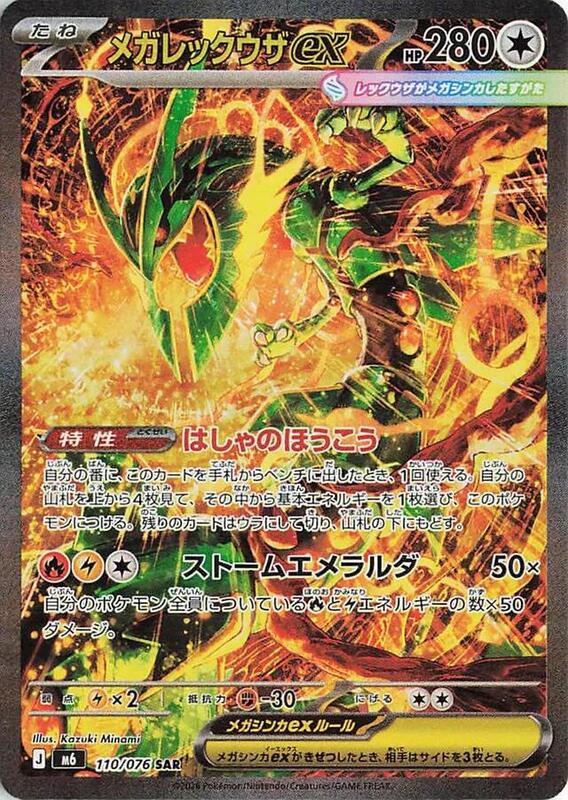
For contrast, 95 of the 271 ceiling-holders average more than $20, and 94 of those 95 come from Sword & Shield onwards: recent high-value chase cards from sets still in active distribution. Below are five of them, the dearest at the ceiling from each of the five dearest sets. Mega Rayquaza ex produced 17 distinct prices and ranged from $376.15 to $600.55, a 59.7% spread inside three weeks. Cynthia's Garchomp ex from Destined Rivals also hit 17 distinct prices but in a tight $226.27 to $238.83 channel, which is what a liquid, well-supplied card looks like: constant small repricing, no drama. Both are real markets. Only one is volatile.
The dearest card at the 17-price ceiling from each of the five dearest sets
| Card | Set | Distinct prices | Low | High |
|---|---|---|---|---|
| Mega Rayquaza ex | M6: Storm Emeralda | 17 | $376.15 | $600.55 |
| Cynthia's Garchomp ex | Destined Rivals | 17 | $226.27 | $238.83 |
| Mega Darkrai ex | Pitch Black | 17 | $191.25 | $212.58 |
| Mega Greninja ex | Chaos Rising | 17 | $164.07 | $184.57 |
| Moltres & Zapdos & Articuno GX | SM Black Star Promos | 17 | $153.05 | $160.17 |
How to read a price once you know this
The practical rule is short. Before you treat a published price as a market price, ask how many times it changed recently. On a card page, a number that has held for three weeks is a seller's opinion; a number that has moved eight times is a market's opinion. The gap between those two things is widest exactly where the money is, which is the uncomfortable half of this study. If you are buying a $500-plus card, there is a coin-flip chance that the price you are anchoring to has not been tested since before you started looking.
The second rule is for sellers. A frozen price at the top of the market is not evidence that your copy is worth that. It is evidence that nobody has agreed to that number recently, and 106 of the 206 cards above $500 are in that position right now. Our liquidity work put trade frequency on trophies at roughly four times a year. Twenty-one days is a twentieth of a year. Finding nothing in that window is not surprising, and treating the unchanged ask as a valuation is the mistake.
Source: our price_history table, 994,132 rows covering 52,542 distinct cards on 21 consecutive days from August 30 to September 19, 2026, recorded from TCGplayer market values. Daily coverage is not uniform across the catalog (between 35,700 and 52,261 cards were priced on any given day), so every frozen-share figure in this article is computed only on the 35,507 cards that produced a reading on all 21 days; that restriction is what makes 'never moved' checkable rather than an artifact of missing days. 'Distinct prices' counts unique values, so a card that moved and moved back counts two. Price bands use the mean price across the window. Set-level figures require at least 60 fully-covered cards in the set and use the set names as recorded on the price series. Nothing here is financial advice. ONE CAVEAT THAT BELONGS IN THE HEADLINE, added on September 22, 2026: on September 7, inside this window, the rule behind the recorded price column changed. Until that morning it recorded the dearest printing of a product; from that morning it records the shared canonical-printing rule, and on multi-printing cards the two are nowhere near each other. 16,915 series show a price change across that one day boundary, out of the roughly 51,900 that were priced on both sides of it, and an unknown share of those changes are the rule moving rather than the market. That biases every figure here in the same direction: a card counted as having moved may only have been re-measured, so 22.0% is a FLOOR on the frozen share, not a point estimate, and so is every band and set figure built the same way. Restricting to the thirteen days from September 7 to September 19, which are all measured the same way, 41.7% of the 35,574 fully-covered cards never moved and 139 of the 206 above $500 never moved, 67.5%. That window is shorter and so freezes more cards by construction, and it is not a like-for-like restatement of the 21-day figures, but it does say that correcting the bias makes the finding stronger rather than weaker. RECHECKED 2026-09-22: every other number in this article reproduces exactly against production, including the row counts, the full distinct-price histogram, all six price bands, the top six frozen sets, the fourteen sets at zero, the per-set medians, 386 frozen cards above $200 and 32 above $1,000, and every card named in the two tables.