

Ask any binder collector which chase class to hold and the answer comes fast: the Special Illustration Rare. It's pulled several times less often than an Illustration Rare, it's the alt-art showcase, and scarcity wins over time. That's the assumption. We tested it against every IR and SIR printed in the Scarlet & Violet era: 403 cards across fourteen English sets, each priced to today on real TCGplayer weekly history, from its post-launch settle (90 days after release, once the opening hype deflates) where our history reaches that far back and from the first week of our history otherwise. The rarer class didn't win. It wasn't close.
The rarer card underperformed in every mature set
Median return to August 2026, from post-launch settle or January 27, 2025, whichever is later · ten of the fourteen sets, see the note below
| Set | IR median | IR % positive | SIR median | SIR % positive |
|---|---|---|---|---|
| SV01 Base (2023) | +120% | 100% | +40% | 70% |
| Paldea Evolved | +110% | 100% | +59% | 87% |
| 151 | +82% | 100% | +39% | 71% |
| Paradox Rift | +71% | 100% | −5% | 47% |
| Temporal Forces | +121% | 100% | +7% | 60% |
| Twilight Masquerade | +99% | 95% | +1% | 55% |
| Stellar Crown | +98% | 100% | −17% | 33% |
| Surging Sparks | +2% | 52% | −46% | 9% |
| Prismatic Evolutions | — | — | −42% | 3% |
| Journey Together | +12% | 55% | −26% | 0% |
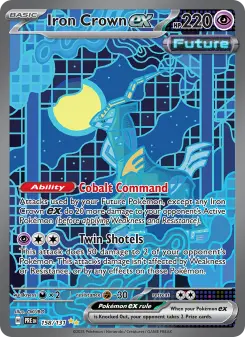
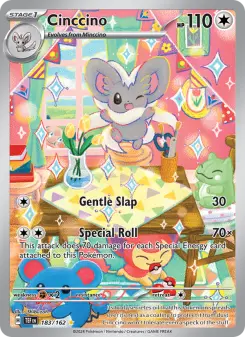
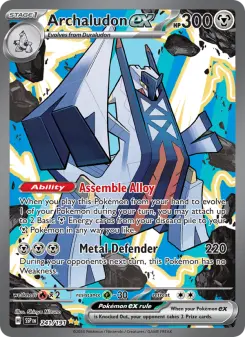
Read the % positive columns. In six of the ten sets above, every single Illustration Rare is worth more today than at the start of its window. The SIR columns collapse as the era progresses: Surging Sparks SIRs are 9% positive, Prismatic Evolutions 3%, Journey Together 0%. And the all-time leaderboard is a shutout: the six best performers in the study are all IRs (Wiglett +371%, Cinccino +294%, Tinkatink +284%), and the six worst are all SIRs (Archaludon ex −64%, Iron Crown ex −63%).
It's not just expensive cards mean-reverting
The natural rebuttal: SIRs launch expensive, IRs launch cheap, and cheap things have more room to run. So we controlled for it, comparing the classes within the same window-start price band. IRs that started between $1 and $20 returned a median +80%; SIRs in the same band, +16%. In the $20 to $60 band: IRs +61%, SIRs −17%. Above $60: SIRs −23%, and there is no IR row to set beside it, because too few Illustration Rares start a window above sixty dollars to median honestly. Same price, same era, same sets. The class itself carries the difference.
Median return over the measured window, matched window-start price bands
Scarcity is priced at the moment of maximum attention
The mechanism is visible in the settle prices themselves. A Special Illustration Rare enters the market with its scarcity fully advertised: pull-rate articles, box-opening videos, day-one price discovery. Recent SIR classes settled at median prices of $58 (Surging Sparks), $77 (Destined Rivals), $101 (Prismatic Evolutions). That price already contains years of expected scarcity premium, paid up front to whoever pulled the card. From there, continuous supply from every case cracked keeps arriving into demand that has already spent its enthusiasm. Illustration Rares settle at $4 to $9 in the shadow of the chase, priced as bulk-adjacent, and then spend the next two years being discovered by the largest buyer pool in the hobby: people who want the beautiful version of a Pokémon they love for the price of lunch. The scarcity was real. The mistake was paying retail for it on day one.
The cards making the argument
Universe: every card with rarity 'Illustration Rare' or 'Special Illustration Rare' in the fourteen main English Scarlet & Violet-era expansions (promo sets excluded), 403 cards with usable history. Prices are TCGplayer weekly market closes, and those asks are the measurement; no sold comps are used. 'Settle' is the first weekly close at or after release + 90 days, which removes launch-spike distortion; sets younger than settle + 6 months (Black Bolt, White Flare) are excluded. Our weekly history begins January 27, 2025, so for any set whose settle date falls before that, the window starts at the first recorded week instead and the row is a since-January-2025 return, not a since-settle return. Seven of the ten sets in the table are in that position, and the callout above names them; the price bands are banded on the window-start price for the same reason. The 12-month column compares each card's price today against 365 days ago and is the age control across sets. Medians are used throughout; per-card returns above are spot-checkable on each card's page. No survivorship trimming inside a reported set: every card with history is counted, including every loser. Four mature sets in the universe are absent from the per-set table and are named in the callout.